Application Statistics
On the test and demo servers all requests of your application will be logged. You can view statistics of your apps or plugins API requests by clicking on „Debug Info“ on the applications list or detail page.
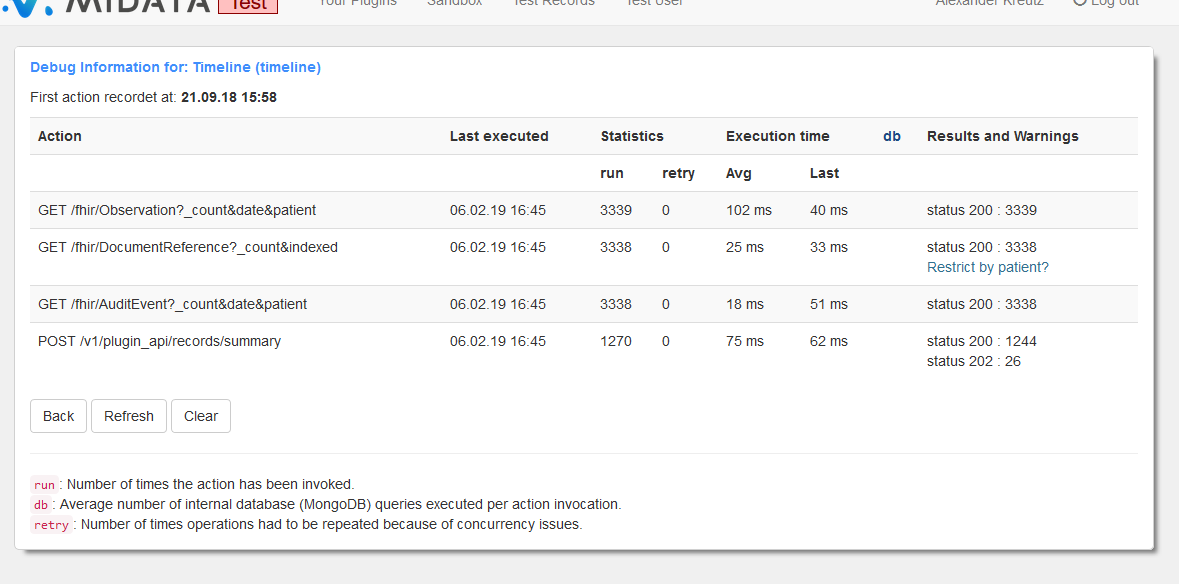
The following information about your plugin or app is recorded:
- What (type of) API calls have been run by this application?
- When was each type of API call last executed? (that is the sort criteria. newest call is diplayed at first)
- How often has each type of API call been executed since start of recording?
- How long did each type of API call last in milliseconds? Average duration and last duration is shown
- How many concurrency conflicts have been caused by this type of API call? (Hopefully 0)
- Which HTTP status has been returned how often?
- Which Exceptions where thrown during execution of this type of API call? (Hopefully none)
- Optimization hints like “add code system to your query”
- For backend optimization: Which types of mongoDB queries have been invoked how often to answer each type of API call. (average) (Shown only if you click on the “db” column)
Click on the “Refresh” button to reload statistics. Click on “Clear” to delete statistics for this application. (After you improved your application)
Optimization hints and Exceptions will added if they happen at least once and will not magically disappear afterwards when the issue as been fixed. To remove these messages you need to clear the statistics.